

Day 7: Limits via Tables and Graphs
- locusfocusmath
- Jul 21, 2021
- 2 min read
Of course before a student should try limits algebraically, they need a visual representation of what they're doing.
I literally remember being in my AP calculus class learning what a limit was. My teacher just kept saying, we're not plugging in the arrow number, we're plugging in numbers close to it. Then she called on me to give an answer, and I HAD NO CLUE WHAT SHE WAS TALKING ABOUT. If I'm not plugging in 5, and I'm plugging in a number close to 5, then what the heck is the answer? I was then rescued by a fellow classmate, and he said, "just plug in 5." And I was wondering why the heck she made that lesson sound so hard when it was as easy as plugging in 5. I'm sure she explained it, but her explanation confused me more than it helped me.
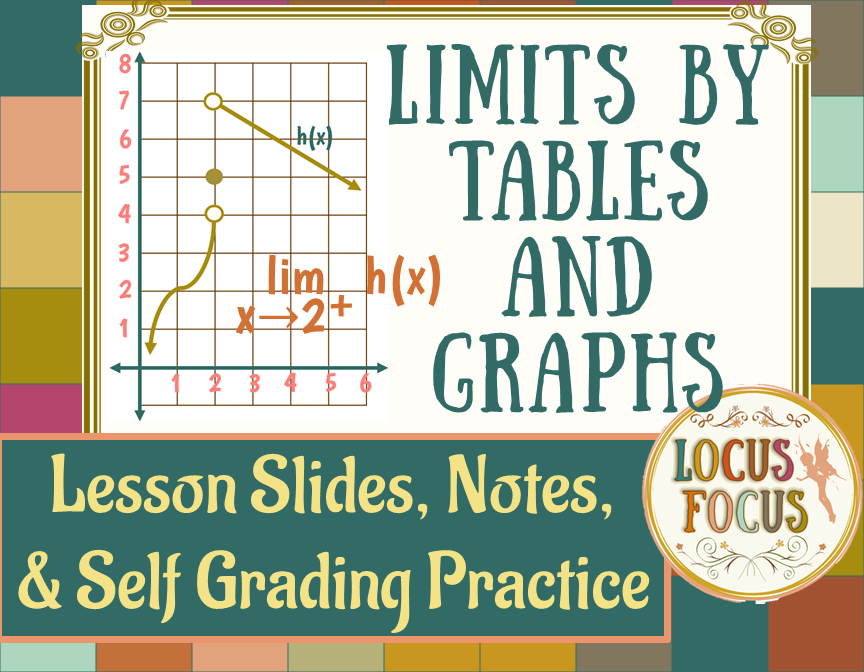
It is super important to have a separate tables and graphs day. The point in this lesson to drive home is that a function can have a hole. I don't go into removable discontinuities on this day or even where the hole comes from, just that a hole can exist in a graph. In a table, it will just be a location where the y-value is undefined. We need a way to talk about what WOULD go there if the graph were continuous.
If you're teaching AP Calculus, it's important go over averaging values to the left and to the right of where the hole is. That's what they expect you to do to get the answer. It makes sense, but it's just a technique to get close to the answer. So if there is a hole at x = 7, then you can take the y-values at 7.001 and 6.999 and average them together to get your guesstimate.
My lesson on this day also includes one-sided limits. It makes sense to take care of that on this day if you have time. If you're class length is only 45 minutes, you may not have time to teach one-sided limits on the same day you introduce limits via tables and graphs.

Comments